
The Complete Guide to Observability: Metrics, Logs, Traces, and OpenTelemetry
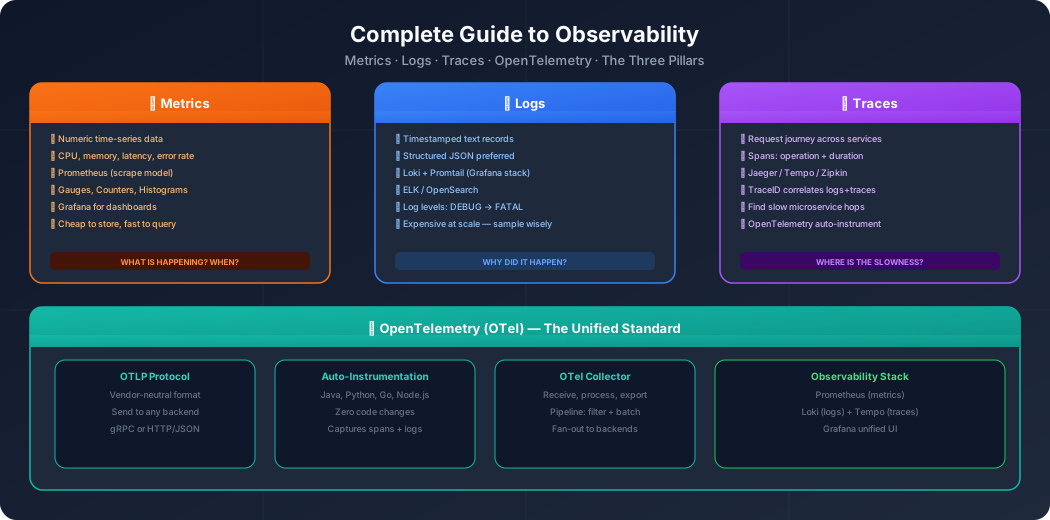
Monitoring tells you when something is broken. Observability tells you why. In a monolith, a stack trace and a log file are usually enough. In a distributed system with 50 microservices, a request passes through 8 services, 3 databases, and 2 message queues. When it fails, you need to trace the entire path, correlate logs from every service, and check metrics at each hop. That is observability.
The Three Pillars
Metrics
What: Numeric measurements over time. CPU usage, request count, error rate, latency percentiles.
Characteristics: Low cardinality, aggregated, cheap to store, ideal for dashboards and alerts.
Example:
http_requests_total{method="GET", path="/api/users", status="200"} 15234
http_request_duration_seconds{quantile="0.99"} 0.45
Tools: Prometheus, Datadog, CloudWatch, InfluxDB.
Logs
What: Timestamped text records of discrete events.
Characteristics: High cardinality, detailed context, expensive to store at scale, essential for debugging.
Example:
{
  "timestamp": "2026-04-27T10:15:32.456Z",
  "level": "ERROR",
  "service": "payment-service",
  "trace_id": "abc123def456",
  "message": "Payment processing failed",
  "error": "Stripe API timeout after 30s",
  "user_id": "user_789",
  "amount": 99.99
}
Tools: Loki, Elasticsearch, Splunk, CloudWatch Logs.
Traces
What: The path of a single request through a distributed system.
Characteristics: Shows causality, latency breakdown per service, identifies bottlenecks.
Example:
Trace: abc123def456
├── [200ms] api-gateway (GET /checkout)
│   ├── [50ms] auth-service (validate token)
│   ├── [120ms] payment-service (charge card)
│   │   ├── [80ms] stripe-api (external call)
│   │   └── [30ms] postgres (insert transaction)
│   └── [20ms] notification-service (send email)
Tools: Jaeger, Zipkin, Tempo, Datadog APM.
How They Work Together
Metrics tell you what is broken: “Error rate on payment-service jumped to 15%.”
Logs tell you why: “Stripe API timeout after 30s.”
Traces tell you where in the request path: “The Stripe external call in payment-service is the bottleneck.”
Correlation is the key. Every log line and trace span should include a trace_id. When an alert fires (metrics), you look up the trace (traces) to find the failing service, then read its logs (logs) for the error details.
OpenTelemetry: The Unified Standard
OpenTelemetry (OTel) is a CNCF project that provides a single, vendor-neutral SDK for collecting metrics, logs, and traces. Instead of using separate libraries for each (Prometheus client for metrics, Logback for logs, Jaeger client for traces), you use one SDK.
Architecture
┌─────────────┐     ┌──────────────────┐     ┌──────────────┐
│ Application │     │  OTel Collector  │     │   Backends   │
│             │────→│                  │────→│              │
│ OTel SDK    │     │ Receives         │     │ Prometheus   │
│ (auto-      │     │ Processes        │     │ Loki         │
│ instrument) │     │ Exports          │     │ Tempo/Jaeger │
└─────────────┘     └──────────────────┘     └──────────────┘
Instrument a Node.js Application
// tracing.js — initialize BEFORE importing app code
const { NodeSDK } = require('@opentelemetry/sdk-node');
const { OTLPTraceExporter } = require('@opentelemetry/exporter-trace-otlp-http');
const { OTLPMetricExporter } = require('@opentelemetry/exporter-metrics-otlp-http');
const { getNodeAutoInstrumentations } = require('@opentelemetry/auto-instrumentations-node');
const { PeriodicExportingMetricReader } = require('@opentelemetry/sdk-metrics');

const sdk = new NodeSDK({
  serviceName: 'payment-service',
  traceExporter: new OTLPTraceExporter({
    url: 'http://otel-collector:4318/v1/traces',
  }),
  metricReader: new PeriodicExportingMetricReader({
    exporter: new OTLPMetricExporter({
      url: 'http://otel-collector:4318/v1/metrics',
    }),
    exportIntervalMillis: 15000,
  }),
  instrumentations: [getNodeAutoInstrumentations()],
});

sdk.start();
Auto-instrumentation automatically traces:
- HTTP requests (incoming and outgoing)
- Database queries (pg, mysql, mongo)
- Redis commands
- gRPC calls
- Message queue operations
OTel Collector Configuration
# otel-collector-config.yaml
receivers:
  otlp:
    protocols:
      grpc:
        endpoint: 0.0.0.0:4317
      http:
        endpoint: 0.0.0.0:4318

processors:
  batch:
    timeout: 5s
    send_batch_size: 1024

exporters:
  prometheus:
    endpoint: 0.0.0.0:8889
  loki:
    endpoint: http://loki:3100/loki/api/v1/push
  otlp/tempo:
    endpoint: http://tempo:4317
    tls:
      insecure: true

service:
  pipelines:
    metrics:
      receivers: [otlp]
      processors: [batch]
      exporters: [prometheus]
    logs:
      receivers: [otlp]
      processors: [batch]
      exporters: [loki]
    traces:
      receivers: [otlp]
      processors: [batch]
      exporters: [otlp/tempo]
The Observability Stack (Grafana LGTM)
A popular open-source stack:
| Component | Purpose | Replaces |
|---|---|---|
| Loki | Log aggregation | Elasticsearch |
| Grafana | Dashboards and visualization | Kibana |
| Tempo | Distributed tracing | Jaeger |
| Mimir | Long-term metrics storage | Thanos |
| Prometheus | Metrics collection | — |
Deploy on Kubernetes with Helm
helm repo add grafana https://grafana.github.io/helm-charts

# Loki (logs)
helm install loki grafana/loki-stack -n monitoring

# Tempo (traces)
helm install tempo grafana/tempo -n monitoring

# Prometheus + Grafana (metrics + dashboards)
helm install kube-prometheus prometheus-community/kube-prometheus-stack -n monitoring
Structured Logging Best Practices
{
  "timestamp": "2026-04-27T10:15:32.456Z",
  "level": "ERROR",
  "service": "payment-service",
  "version": "1.4.2",
  "trace_id": "abc123def456",
  "span_id": "789xyz",
  "message": "Payment processing failed",
  "error.type": "TimeoutError",
  "error.message": "Stripe API timeout after 30s",
  "user.id": "user_789",
  "payment.amount": 99.99,
  "payment.currency": "USD",
  "http.method": "POST",
  "http.url": "/api/payments",
  "http.status_code": 504
}
Rules:
- Always use JSON format (machine-parseable)
- Always include
trace_idandspan_id - Always include
servicename andversion - Use consistent field names across services
- Include relevant business context (user ID, order ID)
- Never log sensitive data (passwords, tokens, PII)
SLOs, SLIs, and Error Budgets
SLI (Service Level Indicator): A metric that measures service quality.
- Availability:
successful_requests / total_requests - Latency:
requests_under_300ms / total_requests
SLO (Service Level Objective): The target for an SLI.
- “99.9% of requests return successfully”
- “95% of requests complete within 300ms”
Error Budget: The allowed amount of failure.
- 99.9% availability = 0.1% error budget = 43.8 minutes of downtime per month
When the error budget is exhausted, freeze feature releases and focus on reliability.
Conclusion
Observability is not about collecting more data — it is about collecting the right data and connecting it. Metrics for alerting, logs for debugging, traces for understanding request flow. OpenTelemetry unifies the instrumentation, so you instrument once and send to any backend. Start with the Grafana LGTM stack (free, open-source), add OpenTelemetry auto-instrumentation to your services, and ensure every log and trace shares a trace_id. The result: when something breaks at 3 AM, you can find the root cause in minutes, not hours.
Related posts:


